A weekly options series doesn’t run Monday to Friday. It runs from one expiry to the next, so the calendar week’s candle isn’t the one that matters to an options trader.
This script draws the expiry-to-expiry candle instead.
What it shows
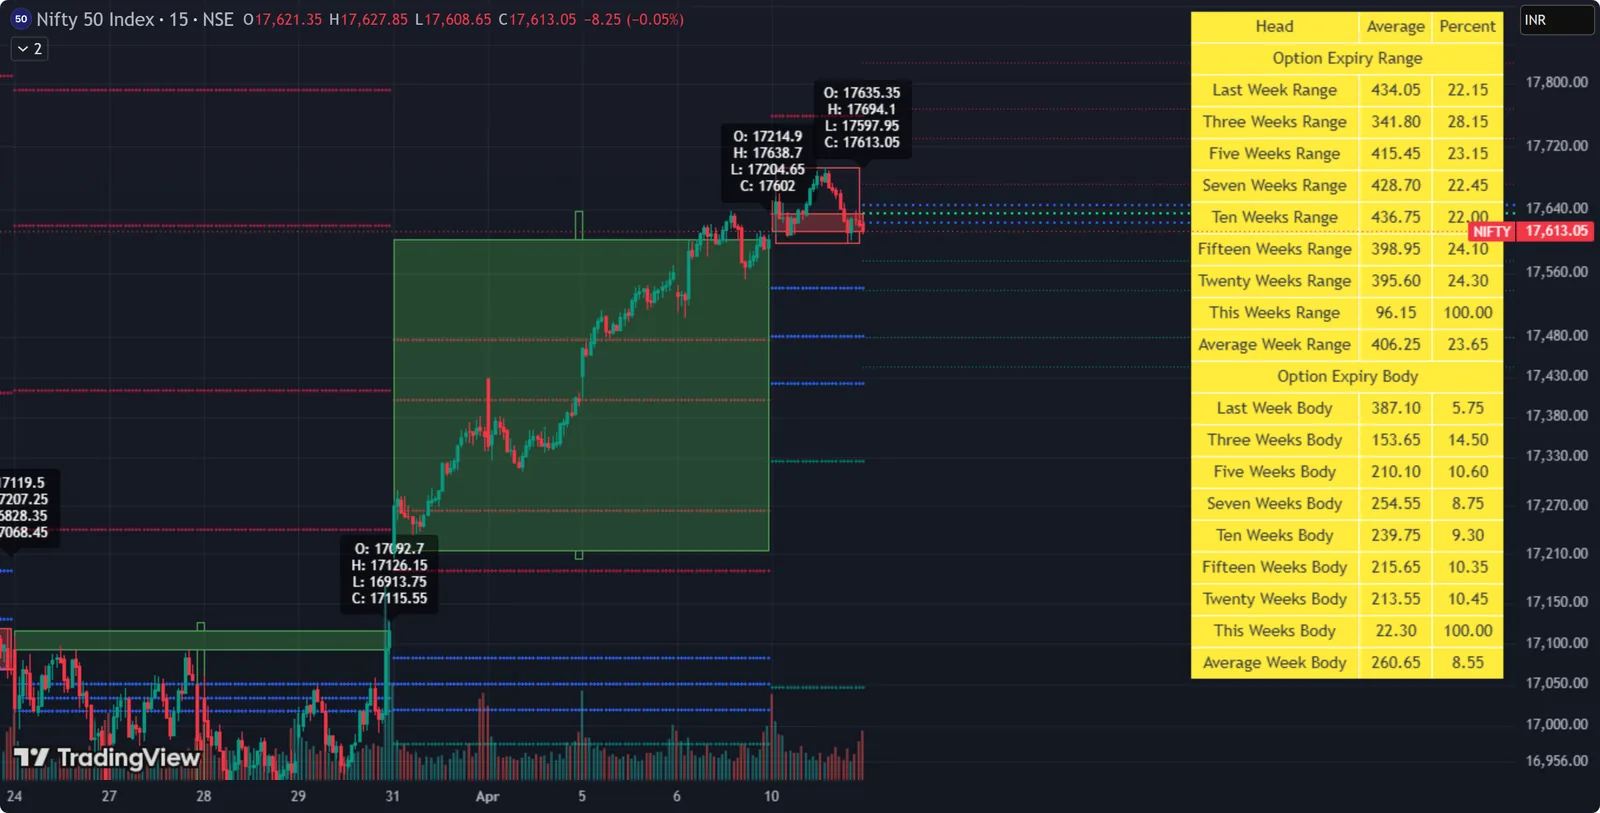
- Every expiry candle as a box on your intraday chart.
- OHLC labels for each expiry period.
- Pivots (floor or Fibonacci) calculated from the expiry candle’s OHLC.
- The developing expiry candle and its pivots, as the current series runs.
- A table of expiry ranges (high to low) and expiry bodies (open to close), averaged over the last 3, 5, 7, 10, 15 and 20 expiries.
Each feature can be switched on or off.
Choose your expiry day
Exchanges change their expiry schedules from time to time. Select the expiry day in the settings and the script adapts.
Version 2
This version replaces my earlier Weekly Options Expiry Candle, removing its limitations and adding the pivots, the developing candle and the statistics table.