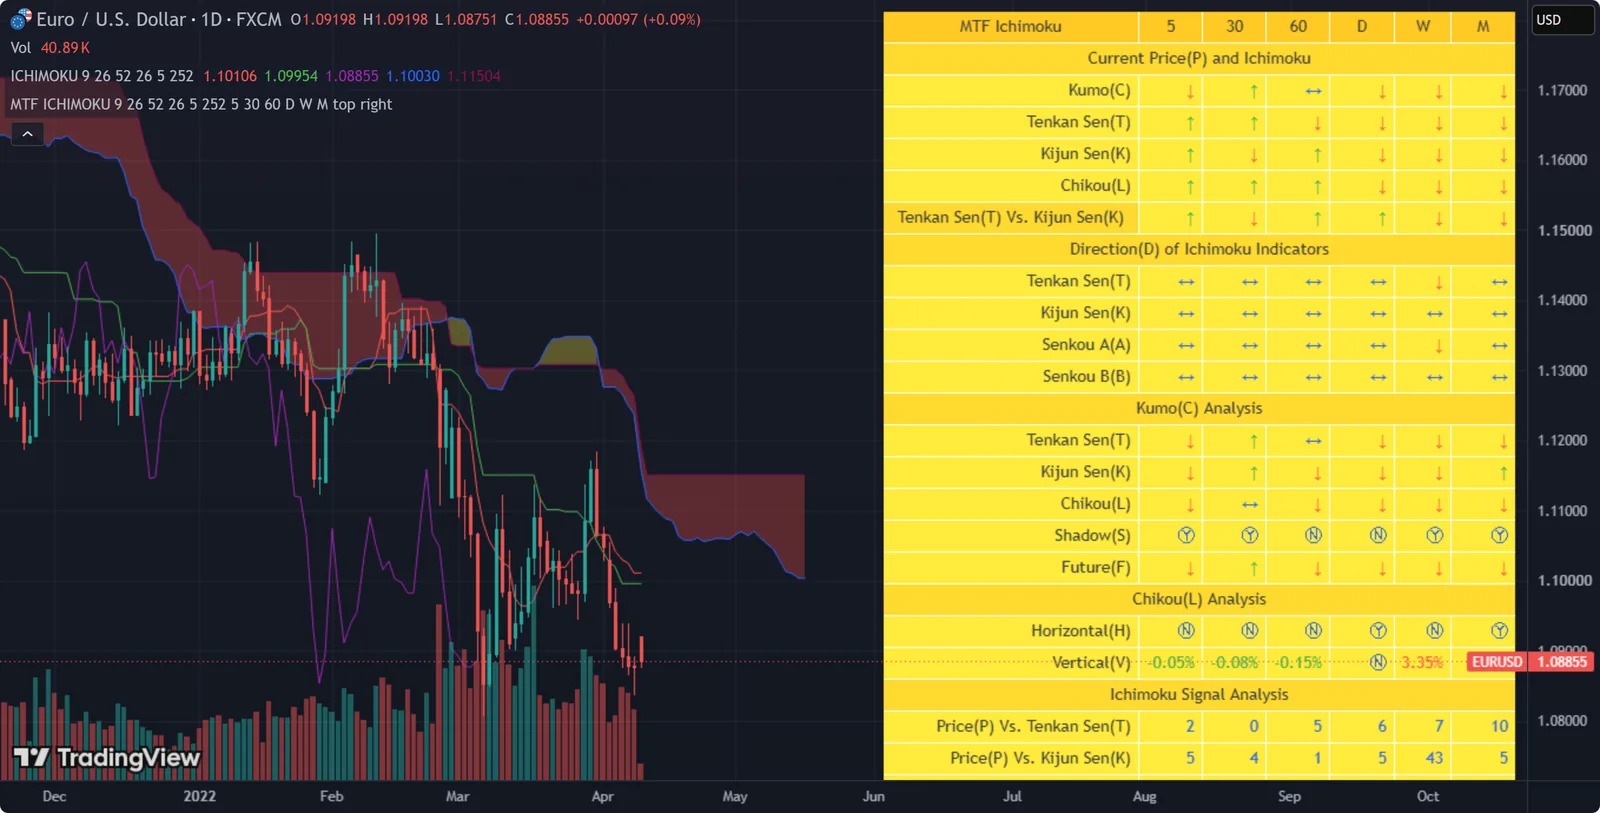
Ichimoku describes market conditions better than any other indicator I know, and it works the same way on every timeframe. Reading it on several timeframes at once gives you the bigger picture.
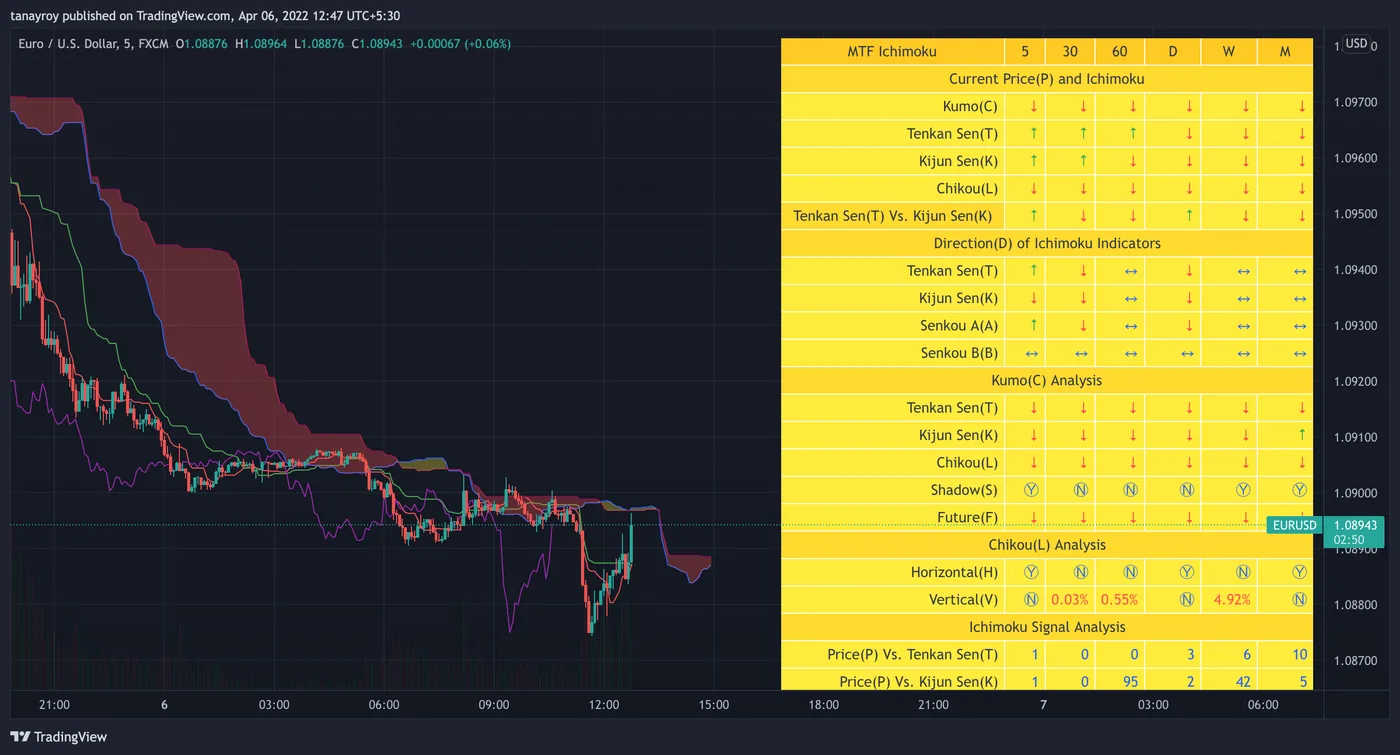
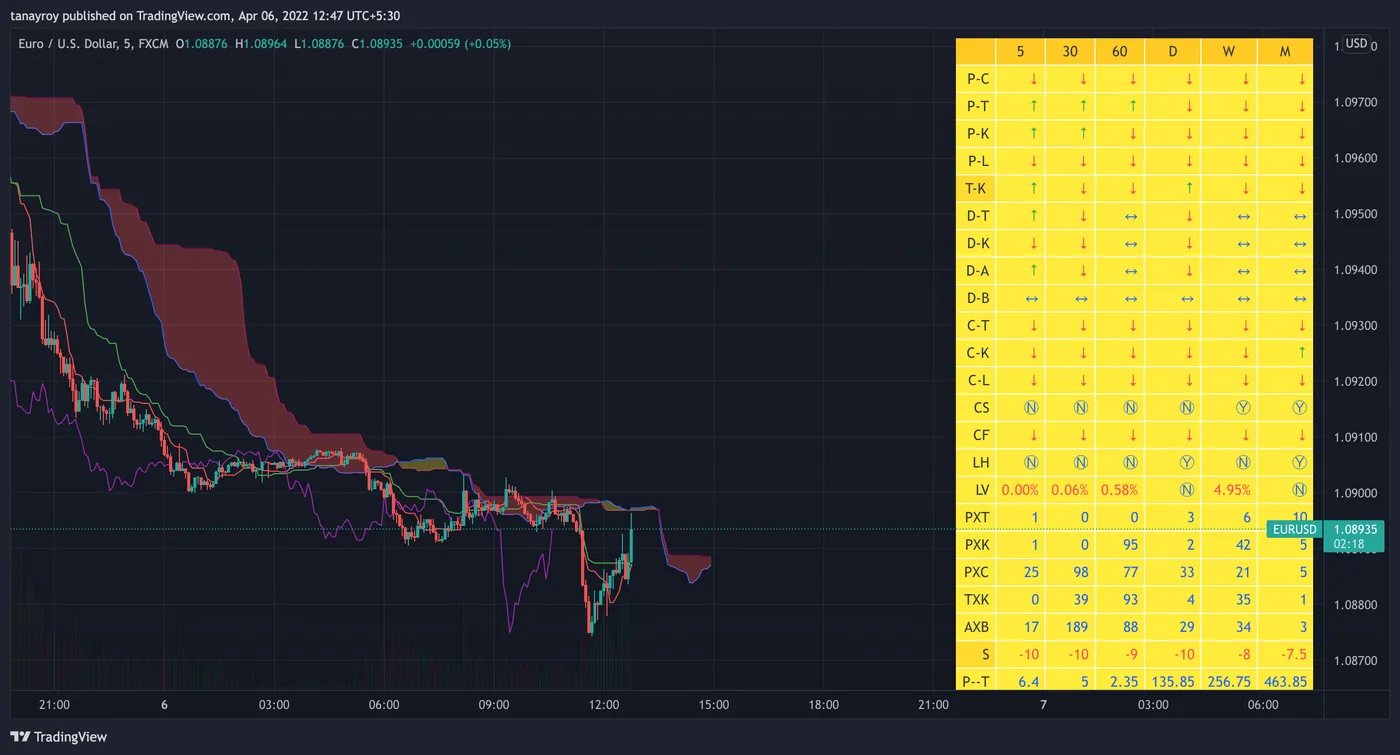
MTF Ichimoku Analysis does that reading for you, on six timeframes in one table. The defaults are 5 minutes, 30 minutes, 1 hour, daily, weekly and monthly, and you can change them.
What it analyses
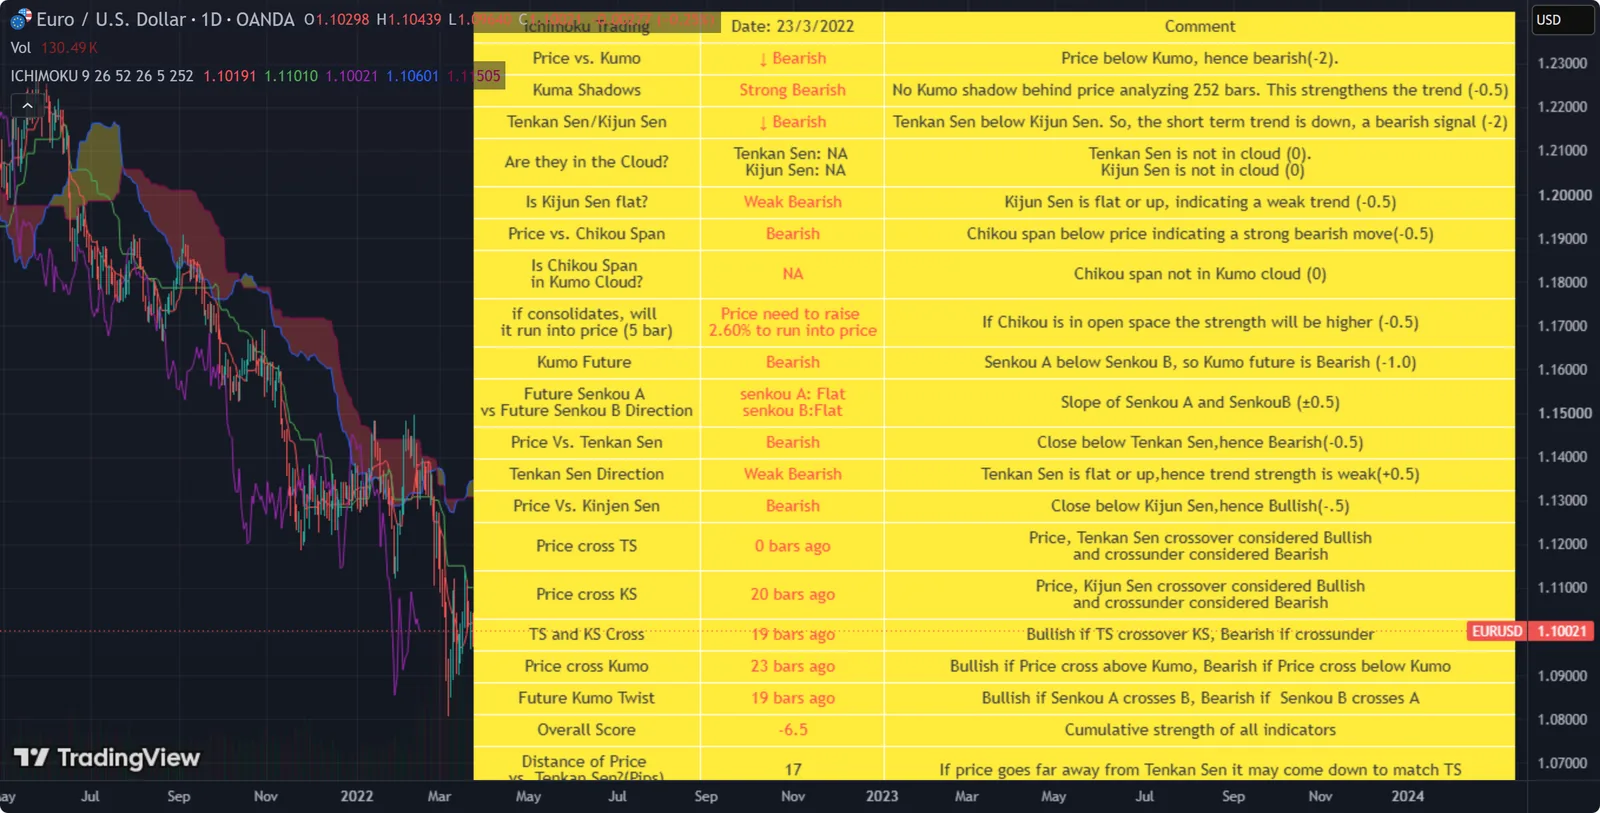
Each relationship is marked bullish (↑), bearish (↓) or neutral (↔), and scored.
Price against the Ichimoku lines
- Price and the cloud (Kumo): ±2
- Price and Tenkan-sen, Kijun-sen, and Chikou against price 26 bars ago: ±0.5 each
Tenkan-sen and Kijun-sen: the short-term against the mid-term trend: ±2
Direction of the lines: the slope of Tenkan, Kijun, Senkou A and Senkou B: ±0.5 each
The cloud against the other lines: Tenkan, Kijun and Chikou against the cloud; the cloud’s shadow behind current price over the last 252 bars (adjustable); and the future cloud (Senkou A against Senkou B): ±0.5 each
Chikou span analysis: vertical and horizontal position of the lagging line.
The scores add up to an overall trend strength for each timeframe.
How to use it
Look for agreement. When most timeframes point the same way, the trend is strong. When the short timeframes disagree with the long ones, the market is in transition.
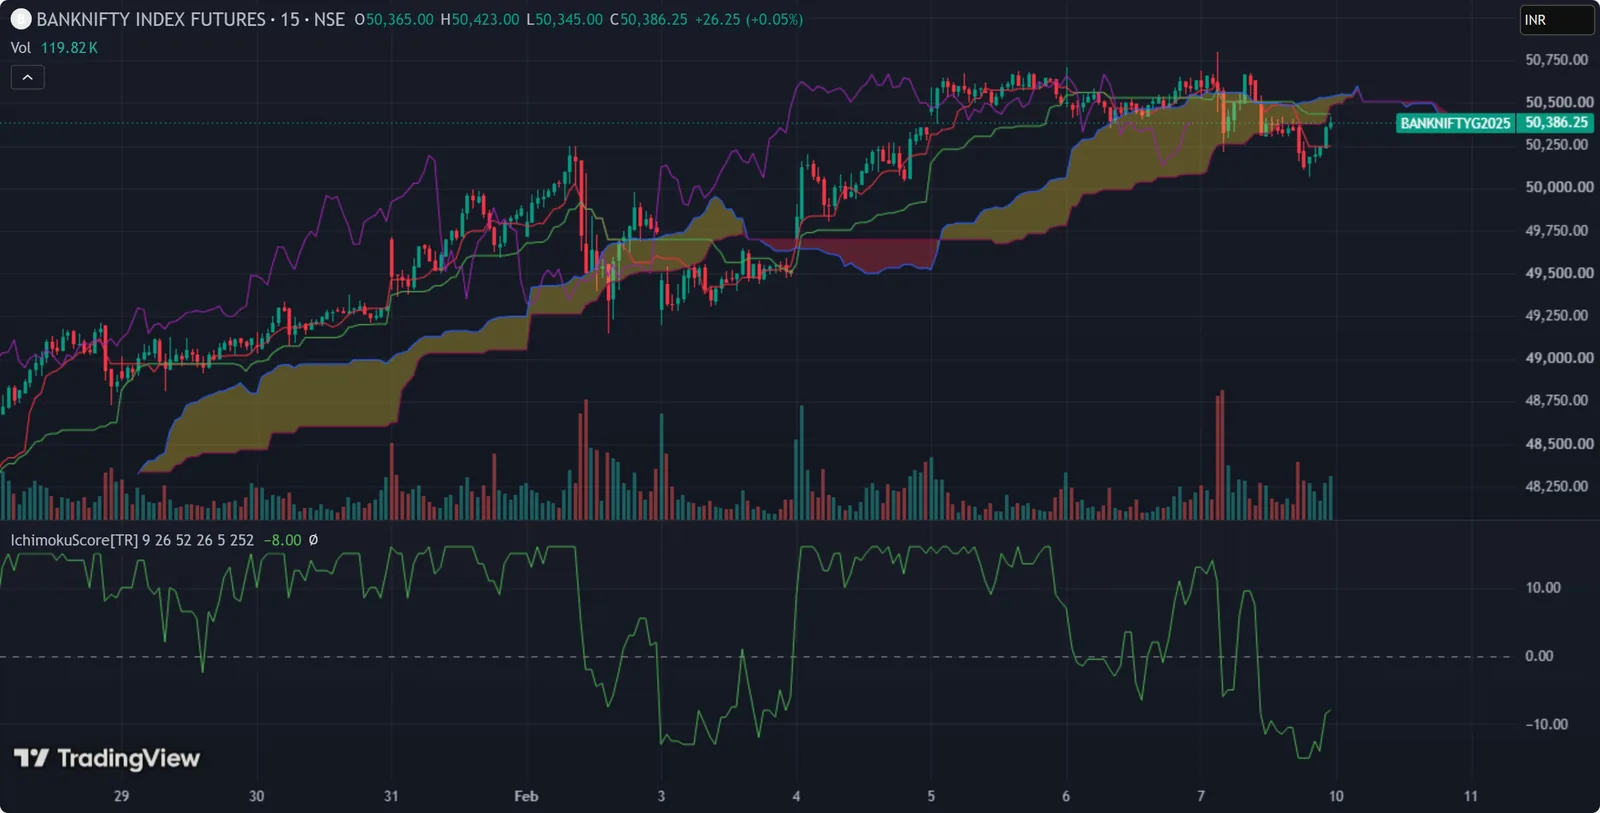
Related: Ichimoku Score Indicator turns a similar scoring idea into an oscillator on a single timeframe.