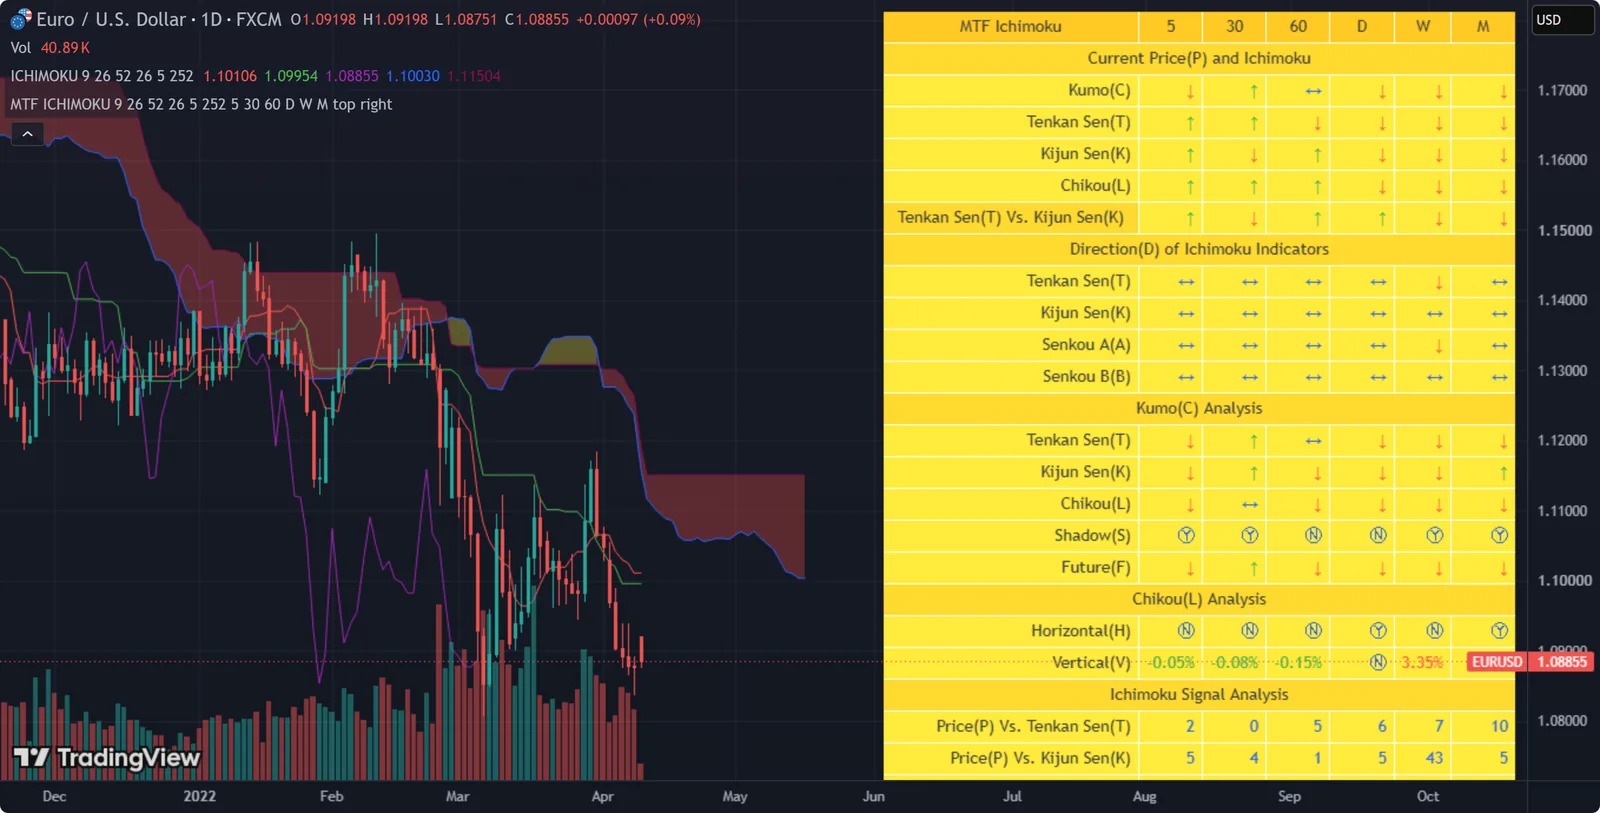
The Ichimoku Cloud shows market state through five components. The insight is in how they relate to each other and to price, which takes practice to read.
This indicator quantifies those relationships into a single score.
How the score is built
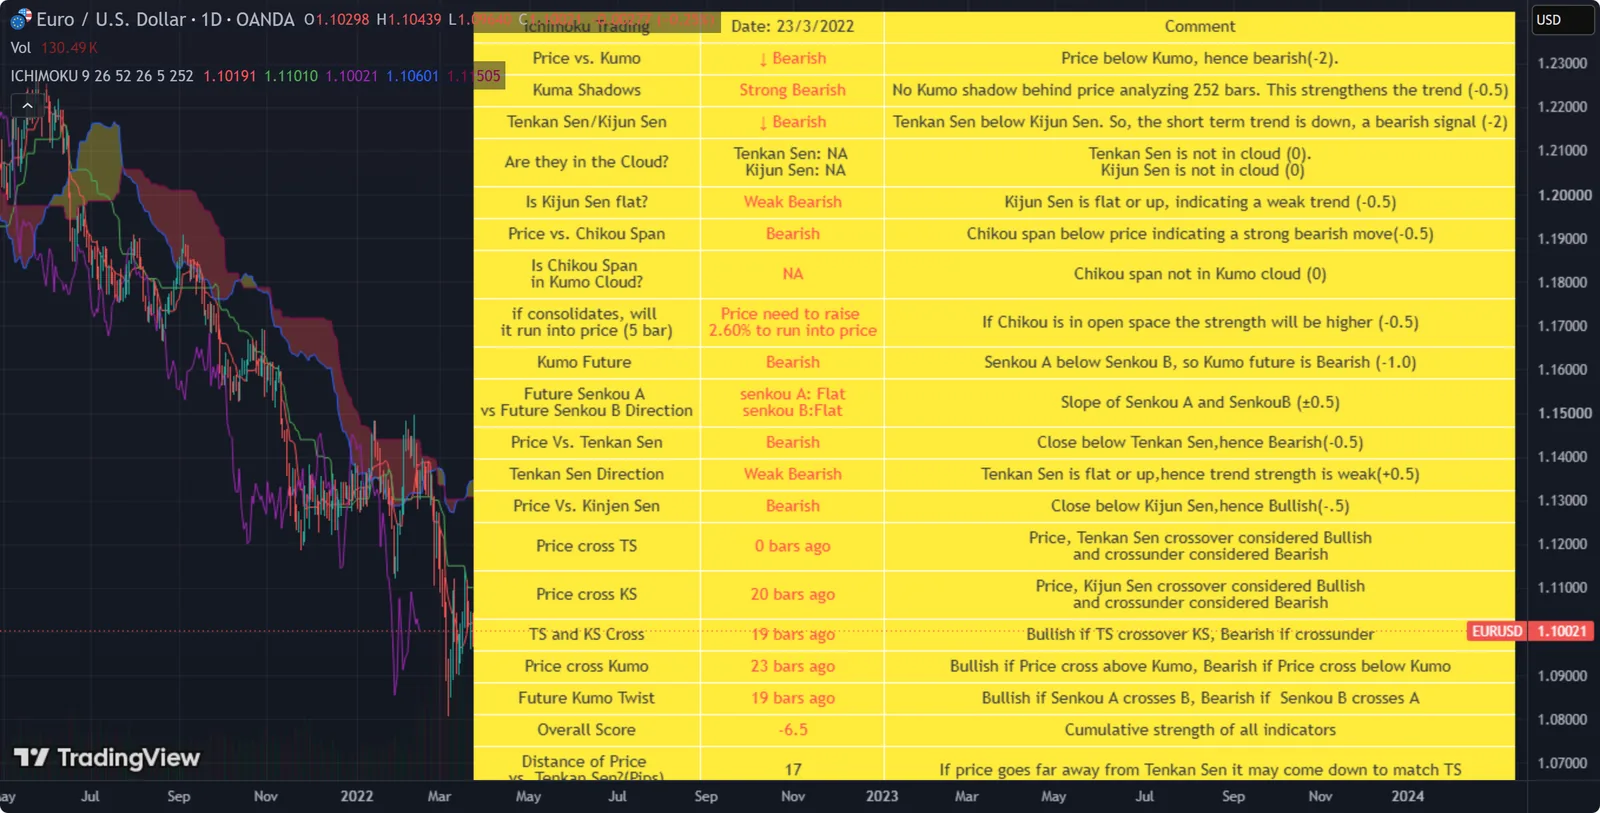
Each relationship adds or subtracts points. The weights can be changed in the settings.
| Relationship | Points |
|---|---|
| Price vs Kumo (cloud) | 2 |
| Price vs Kumo shadow | 0.5 |
| Tenkan vs Kijun | 2 |
| Tenkan vs Kumo | 0.5 |
| Kijun vs Kumo | 0.5 |
| Tenkan slope | 0.5 |
| Kijun slope | 0.5 |
| Price vs Chikou | 2 |
| Chikou vs Kumo | 0.5 |
| Chikou consolidation | 0.5 |
| Senkou A vs Senkou B | 2 |
| Senkou slope | 0.5 |
| Price vs Tenkan | 2 |
| Price vs Kijun | 2 |
Reading it
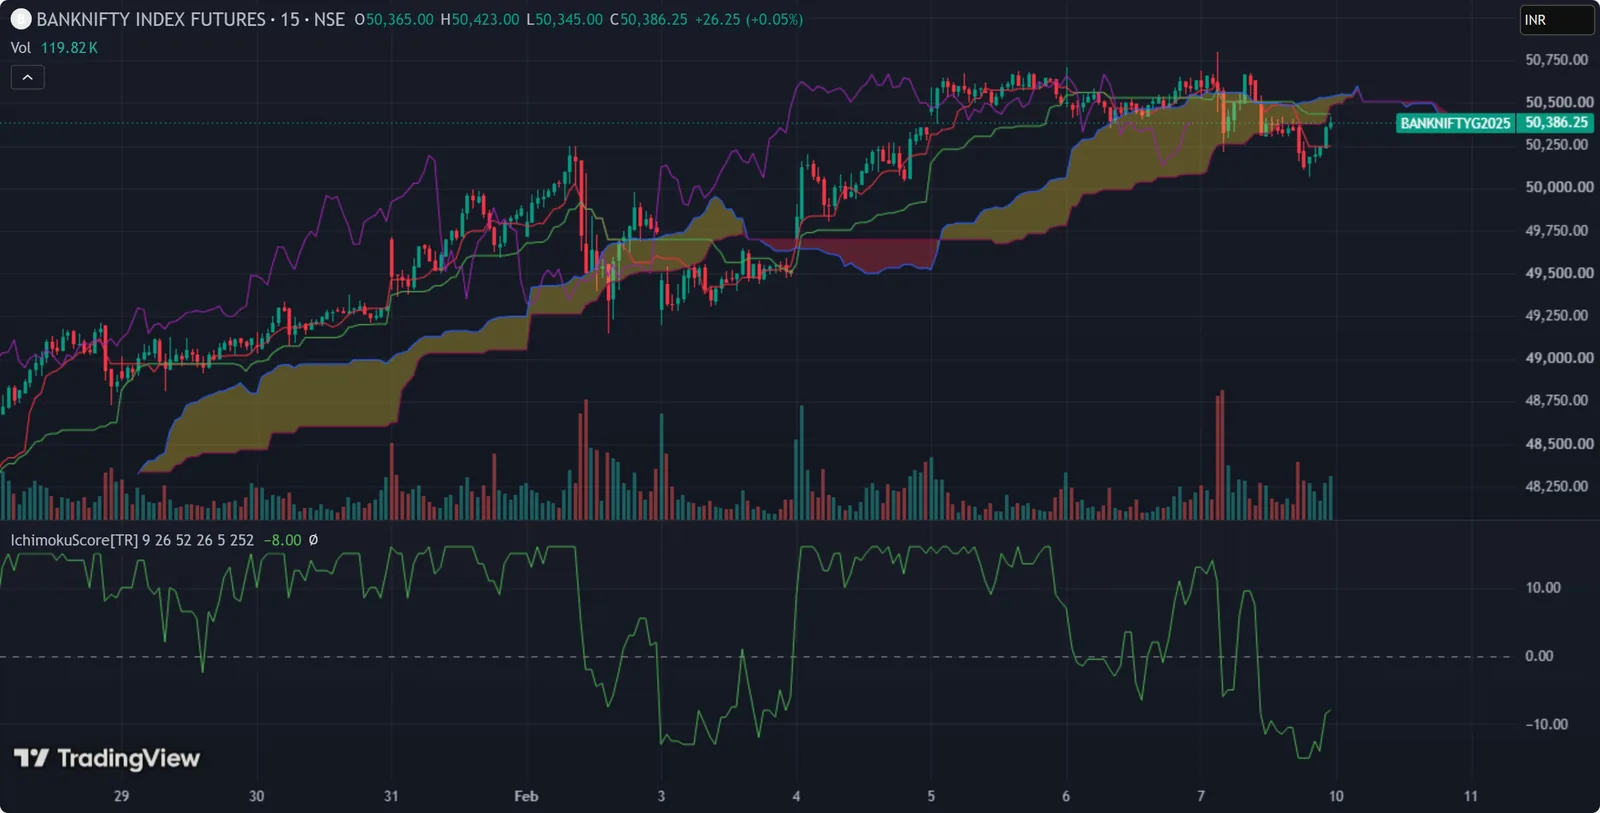
The total works as an oscillator between −16 and +16:
- a higher score means stronger bullish conditions,
- a lower score means bearish conditions.
A 9-period SMA smooths the score so it’s easier to read.
Using it in a strategy
Because the score is a single number, it’s easy to use in rules: for example, only take long trades while the smoothed score is above a threshold. That makes Ichimoku testable, rather than a matter of interpretation.