A candlestick pattern on a 5-minute chart means more when the 1-hour or daily chart is telling the same story. This script shows them all at once.
What it does
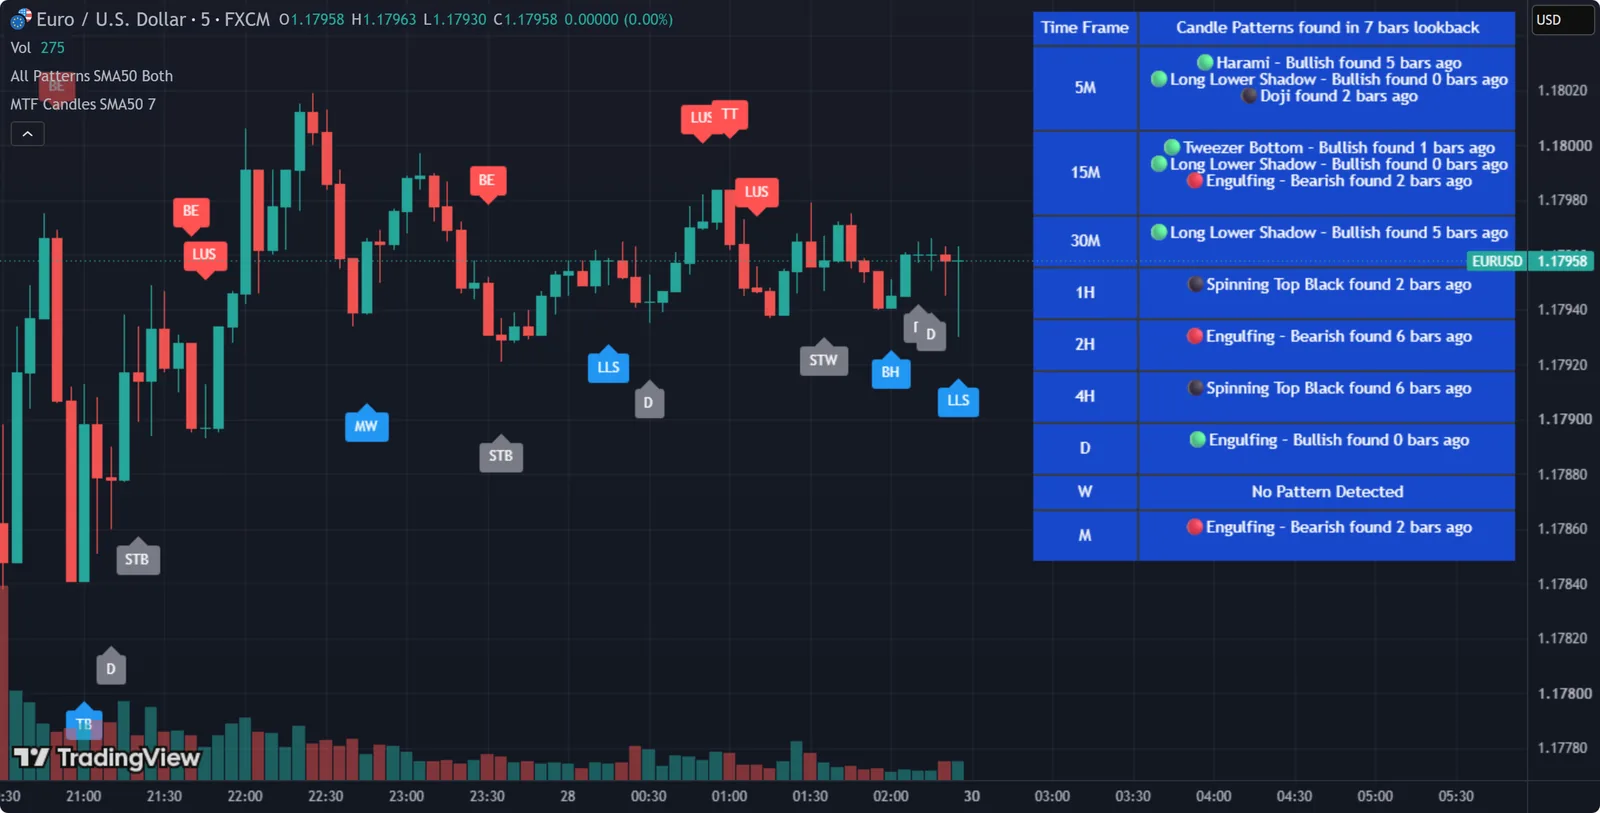
It screens nine timeframes (5m, 15m, 30m, 1H, 2H, 4H, daily, weekly and monthly) and lists every candlestick pattern found within a lookback period, with how many bars ago it formed and whether it’s bullish or bearish.
The pattern detection logic is TradingView’s own built-in candlestick logic.
Settings
- Trend detection method
- Lookback period: how many recent bars to search
- Patterns: choose which patterns to screen for
How to use it
It works best on a 5-minute chart, so every higher timeframe is visible in the table.
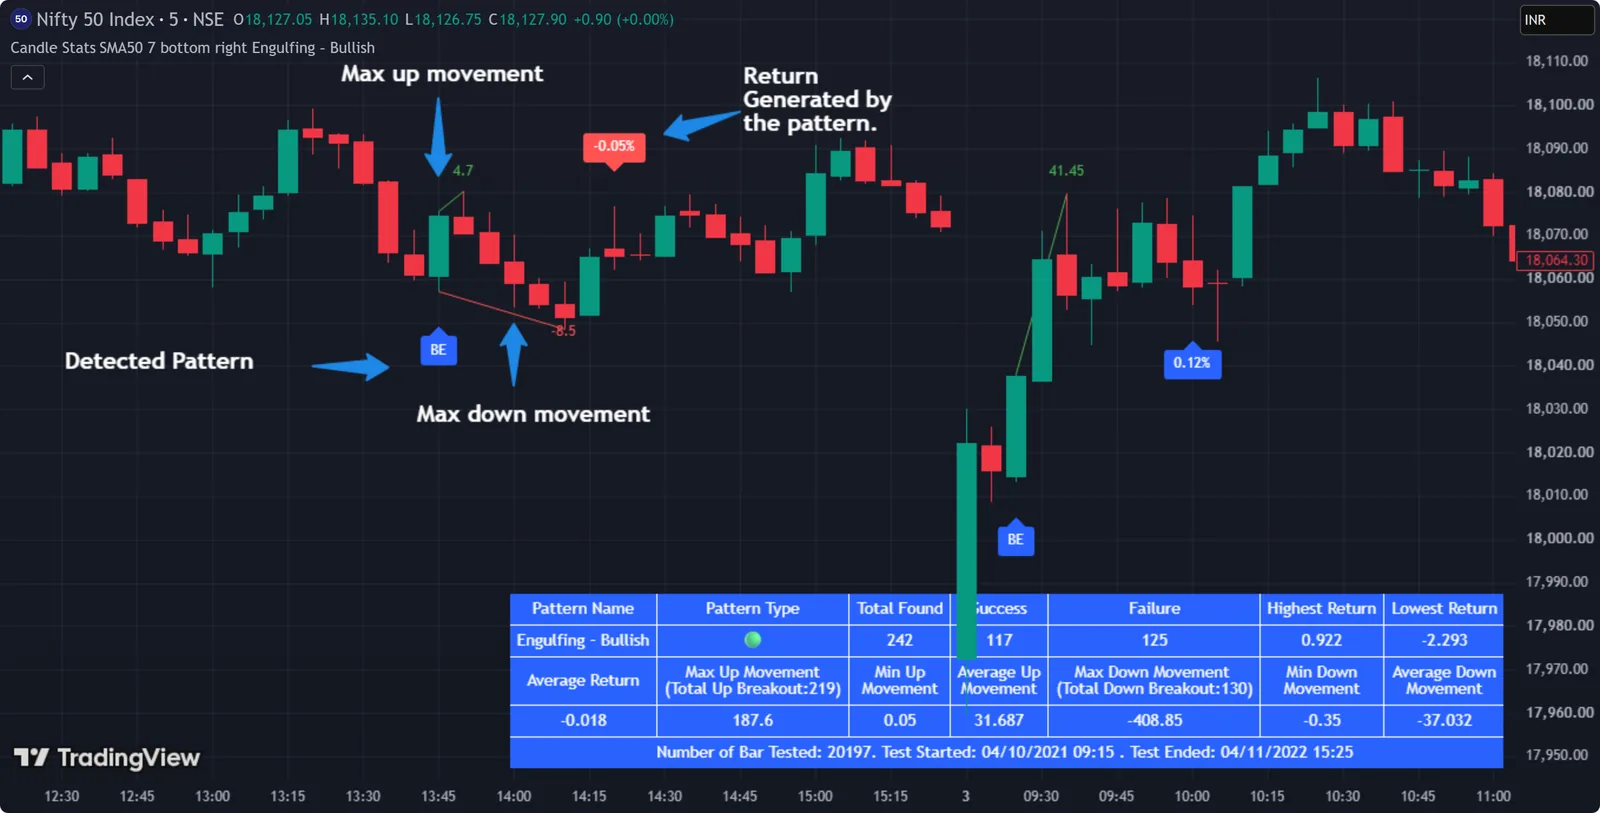
Spotting a pattern is the first step. To find out whether a pattern has actually worked on your market, measure it with Candlestick Stats.