Candlestick patterns are easy to spot and hard to trust. A hammer or an engulfing candle looks meaningful, but does it actually lead anywhere on the market you trade?
Candlestick Stats answers that with numbers. It finds every occurrence of a pattern on your chart and measures what happened next.
What it shows
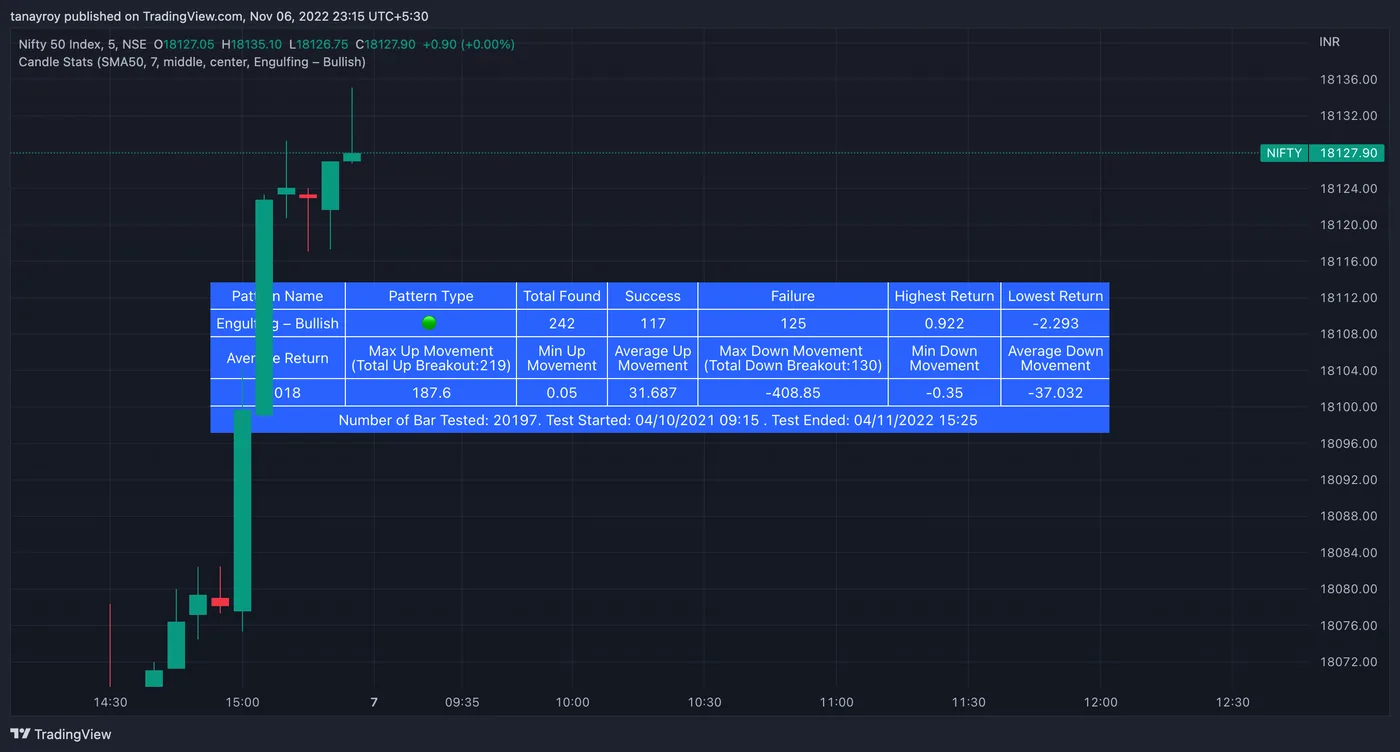
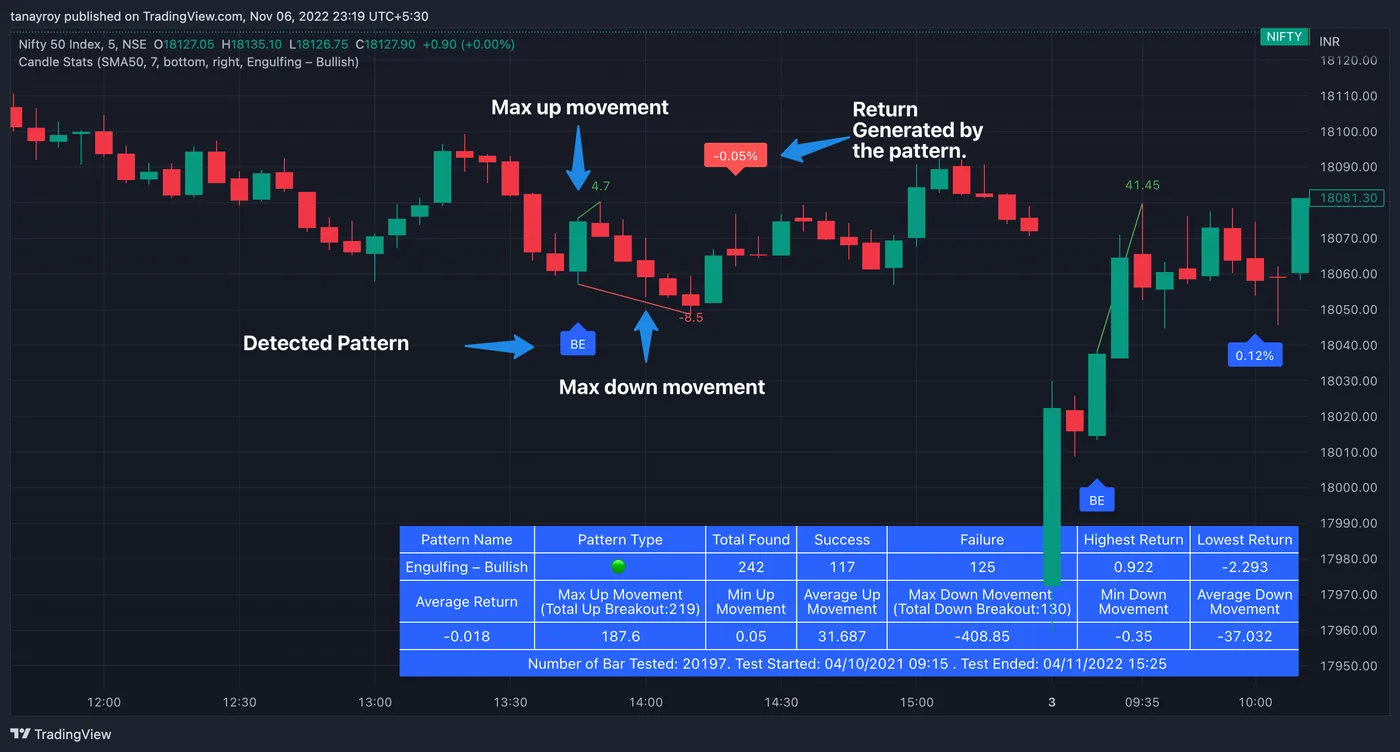
Pick one of 44 predefined candlestick patterns and a holding period. The statistics panel then shows:
- Total found: how many times the pattern appeared on the chart.
- Success and failure: how often it produced a positive or a negative return.
- Highest, lowest and average return, assuming a trade at the open of the next candle, closed at the end of the holding period.
- Up breakouts: how often price broke above the pattern’s high, with the maximum, minimum and average move.
- Down breakouts: the same for breaks below the pattern’s low.
- Coverage: the number of bars tested, with the start and end dates, so you know how much history the numbers rest on.
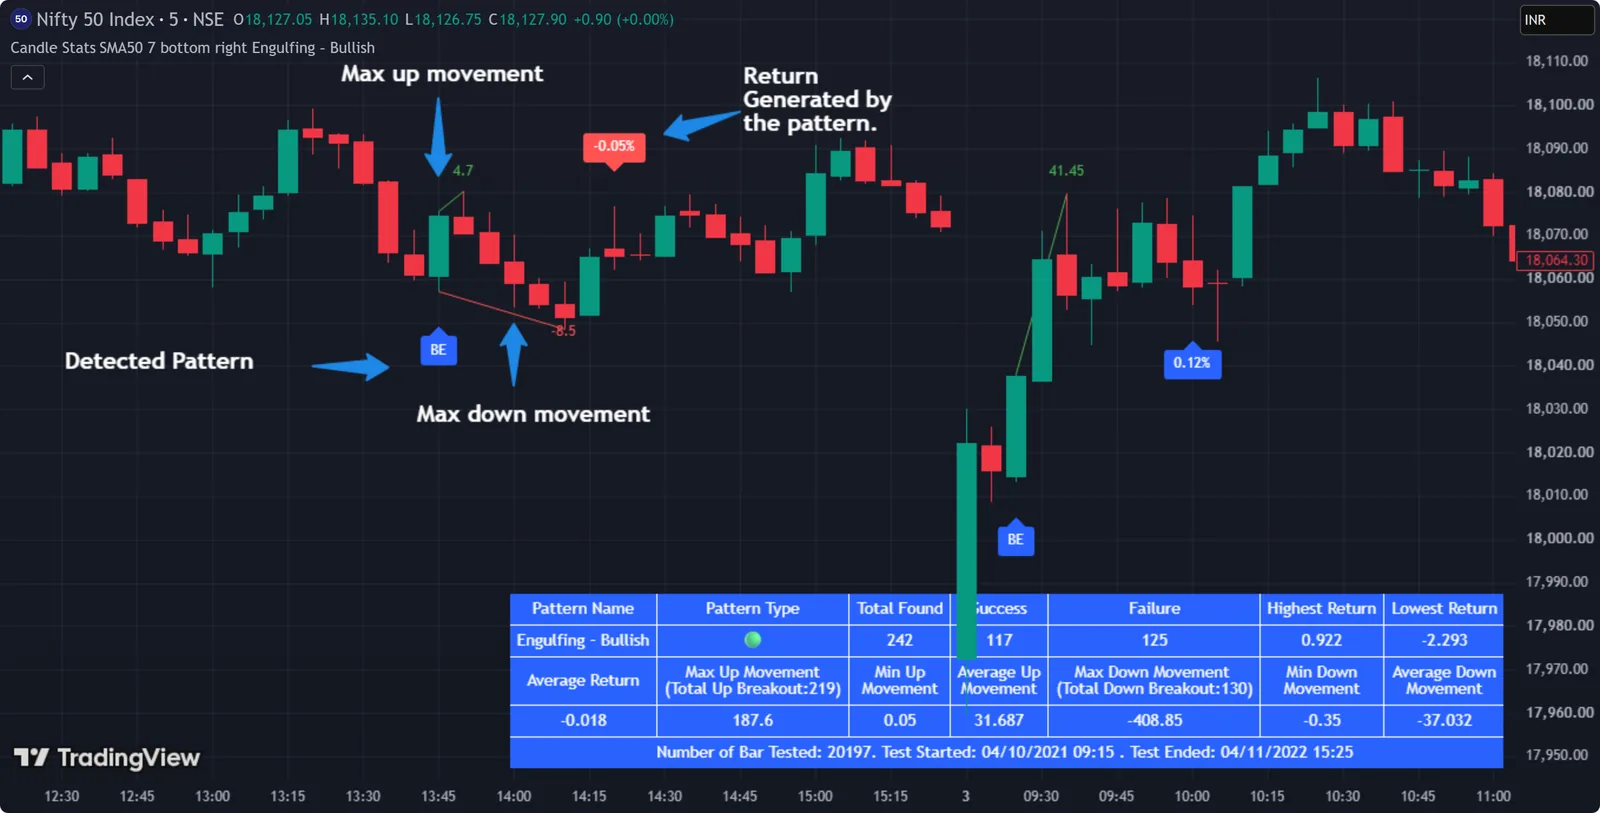
Each detected pattern is also marked on the chart, so you can inspect the cases yourself.
How to use it
- Add Candlestick Stats to your chart from Indicators → Invite-only scripts.
- Choose a pattern.
- Set Stat bars to the number of candles you would normally hold a trade.
- Choose a trend filter if you only take patterns in the direction of the trend.
- Read the panel, and check the coverage line before trusting a result. A pattern that appeared 12 times proves very little.
Settings
| Setting | What it does |
|---|---|
| Detect trend | Trend filter: SMA 50, SMA 50/200, or none |
| Stat bars | Holding period after the pattern, in candles |
| Select pattern | One of the 44 predefined patterns |
| Panel position | Where the statistics table sits on the chart |
| Label colour | Colour of the pattern labels |
If a pattern isn’t available on the current data, the script shows an error instead of empty statistics.
Good to know
- Works on any market and any timeframe.
- Statistics describe the past on the chart you’re looking at. Test the same pattern on several symbols and periods before you rely on it.
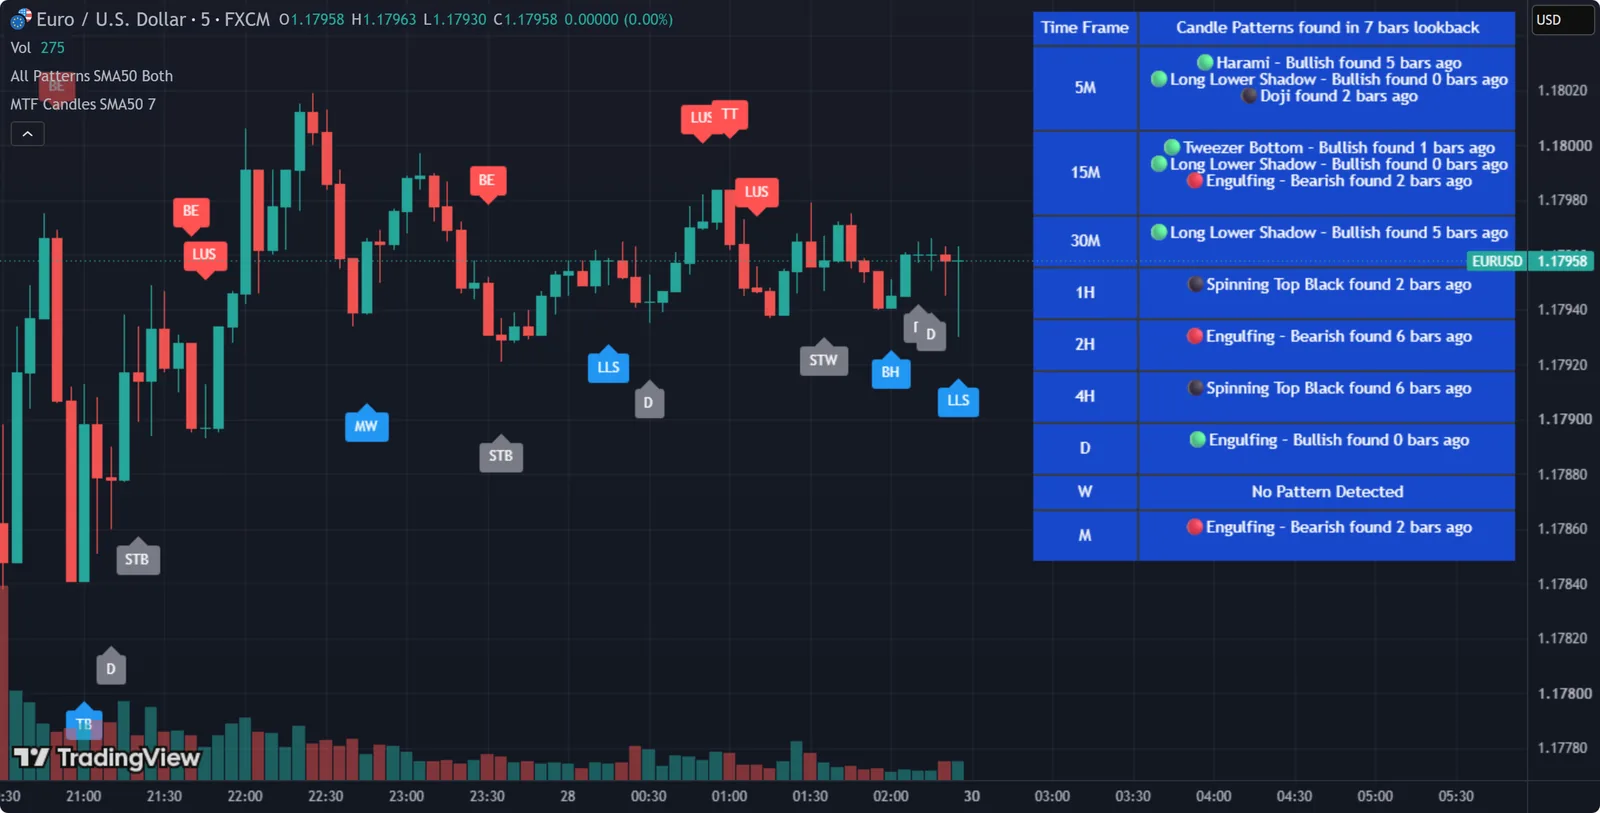
- For a free starting point, MTF Candlestick Patterns Screening shows which patterns are forming right now across timeframes.