Bank Nifty is made up of a dozen banks listed on the National Stock Exchange of India. Where the index goes depends on what those stocks do, and on how heavily each one is weighted.
This script puts all of them in one table on your chart.
What it shows
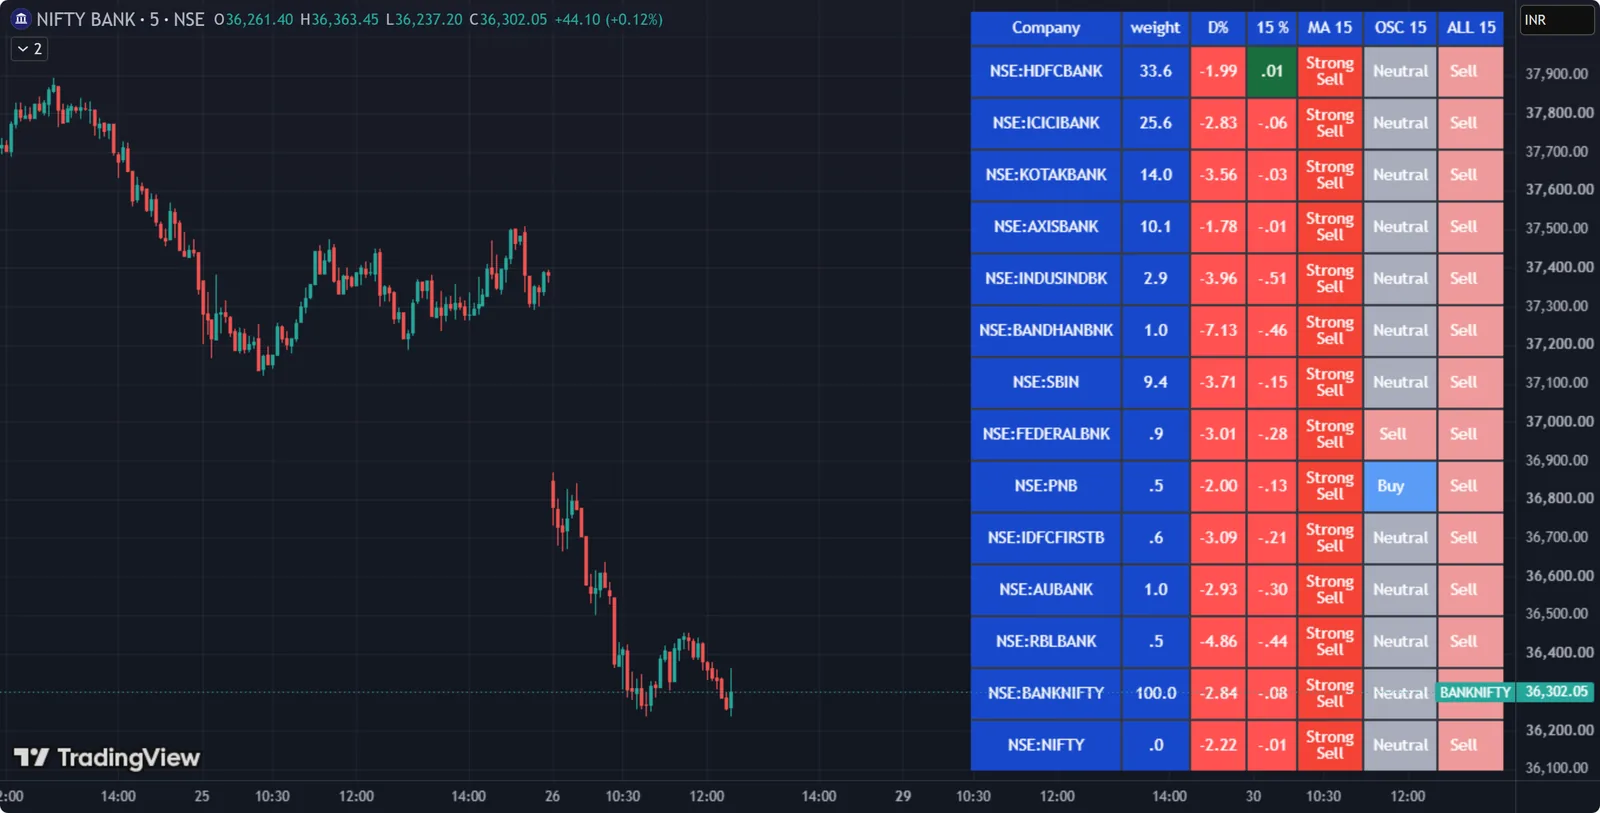
For each constituent:
- its approximate weight in the index,
- its price change, and
- its technical rating: moving averages, oscillators and overall, from Strong Sell to Strong Buy.
Good to know
The weights are calculated from annual free-float data available in TradingView, so they can differ noticeably from the official index weights. Treat them as a guide.
Use it to see whether a move in Bank Nifty is broad, or carried by one or two heavyweights.