In 2025 I took a free TradingView indicator, HalfTrend, and turned it into a strategy.
Then I let a genetic algorithm search thousands of filter combinations to improve it.
The result looked excellent. This is its full backtest report.
It is also a good example of why a report like this should make you more careful, not less.
This is research, not a trading recommendation. Backtest results are hypothetical and do not predict future returns.
Where this strategy came from
This report is the end of a series:
- Part 1: choosing an indicator to convert.
- Part 2: turning HalfTrend into a strategy, testing it across five markets, and optimising its filters.
- Part 3: the robustness tests a strategy should pass before it gets real money.
The strategy here is the optimised version from Part 2: HalfTrend signals on NIFTY futures, with entry filters chosen by the algorithm.
The test setup
| Market | NIFTY futures (NSE:NIFTY1!) |
|---|---|
| Timeframe | 15 minutes |
| Period | 19 Jan 2023 to 27 Mar 2025 (27 months) |
| Starting capital | ₹3,00,000 |
| Size | 1 lot (point value 75) |
| Commission and slippage | None modelled |
The results
| All trades | Long only | Short only | |
|---|---|---|---|
| Net profit | ₹3,44,021 | ₹3,41,366 | ₹2,655 |
| Trades | 95 | 52 | 43 |
| Win rate | 50.5% | 53.8% | 46.5% |
| Profit factor | 2.01 | 3.02 | 1.02 |
| Average win / average loss | 1.97 | 2.59 | 1.17 |
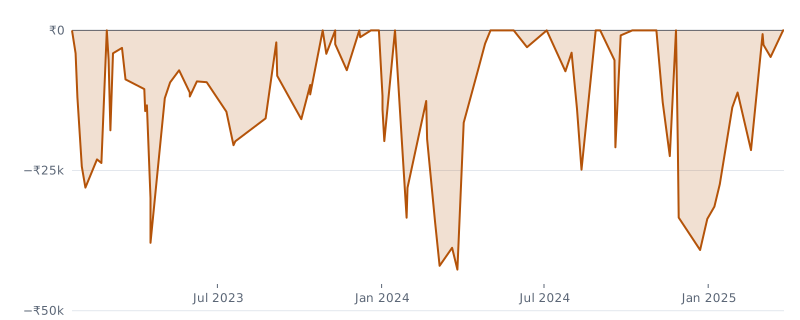
| Max drawdown | ₹42,671 (14.2%) | ₹23,333 (7.8%) | ₹66,514 (22.2%) |
| Longest stretch without a new high | 234 days | 114 days | 517 days |
Drawdown percentages are measured against starting capital.
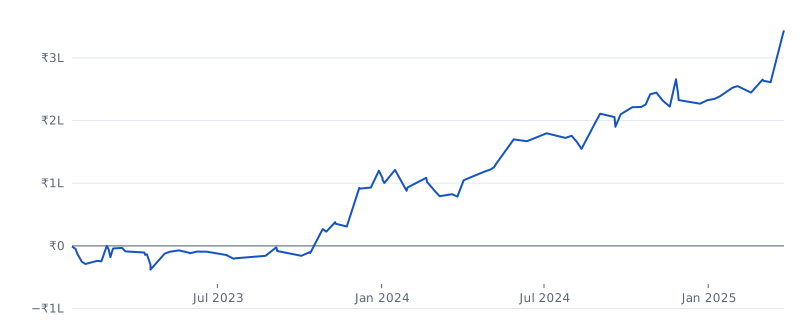
On the face of it: capital more than doubled (+115%) in 27 months, with a drawdown of 14%.
Month by month
| Year | Jan | Feb | Mar | Apr | May | Jun | Jul | Aug | Sep | Oct | Nov | Dec | Total |
|---|---|---|---|---|---|---|---|---|---|---|---|---|---|
| 2023 | −₹25,249 | ₹25,155 | −₹8,738 | −₹29,145 | ₹26,081 | ₹2,565 | −₹10,549 | ₹4,080 | ₹7,601 | ₹30,825 | ₹8,205 | ₹89,212 | ₹1,20,045 |
| 2024 | −₹26,828 | ₹8,681 | −₹23,272 | ₹40,312 | ₹51,082 | −₹3,011 | ₹5,378 | ₹25,522 | ₹12,128 | ₹31,976 | −₹9,326 | −₹218 | ₹1,12,425 |
| 2025 | ₹19,879 | −₹7,616 | ₹99,289 | ₹1,11,551 |
Five reasons I don’t trust it yet
1. The filters were chosen by looking at this exact data
A genetic algorithm tried thousands of filter combinations on this period and kept the best one.
So this report describes the period it was fitted to. It does not tell you how the strategy behaves on data it has never seen.
That is the definition of an in-sample result. It needs an out-of-sample test before it means anything.
2. The short side is doing nothing
The long side made ₹3,41,366. The short side made ₹2,655.
Shorts had a profit factor of 1.02, the deepest drawdown of the three (22%) and went 517 days without a new high.
NIFTY rose over most of this period. A trend strategy that only works long in a rising market may be measuring the market, not an edge.
3. Two months made more than half the money
December 2023 (₹89,212) and March 2025 (₹99,289) together produced ₹1,88,501: 55% of the total profit.
The largest single trade, ₹77,891, was 23% of it.
Remove a handful of the best trades and the picture changes a lot. That is a test worth running before anything else.
4. 95 trades is a small sample
95 trades over 27 months is enough to describe what happened. It is not enough to be confident it will happen again.
The longest flat stretch was 234 days. You would need the patience to sit through that live.
5. No costs, and buy-and-hold did better
The test modelled no brokerage, taxes or slippage. On 95 round trips in futures, those are real money.
TradingView’s own buy-and-hold figure for the same period was ₹4,15,376, more than the strategy made. The strategy had a smaller drawdown, but it did not beat simply holding.
What would make me trust it
These are the tests I would run before a single rupee went in:
- Out-of-sample: run the same filters on data after March 2025.
- Remove the best trades: drop the top 5 and see what survives.
- Monte Carlo: reorder and resample the 95 trades to see the range of drawdowns this edge could produce.
- Add costs: realistic brokerage and slippage per trade.
- Long only: test whether dropping the short side improves robustness, rather than just the headline number.
I wrote a whole book about this process: Seven Tests Before You Go Live. Every test runs in a spreadsheet.
If you have a TradingView export of your own, JSK TradeProof runs these checks for you: Monte Carlo, what-if scenarios, out-of-sample and walk-forward splits.
The scripts
- HalfTrend Strategy Basic: the unfiltered conversion from Part 2.
- HalfTrend Strategy Advanced: the optimised version tested here.
Both are research scripts. Treat them as a starting point for your own testing, not a system to trade.