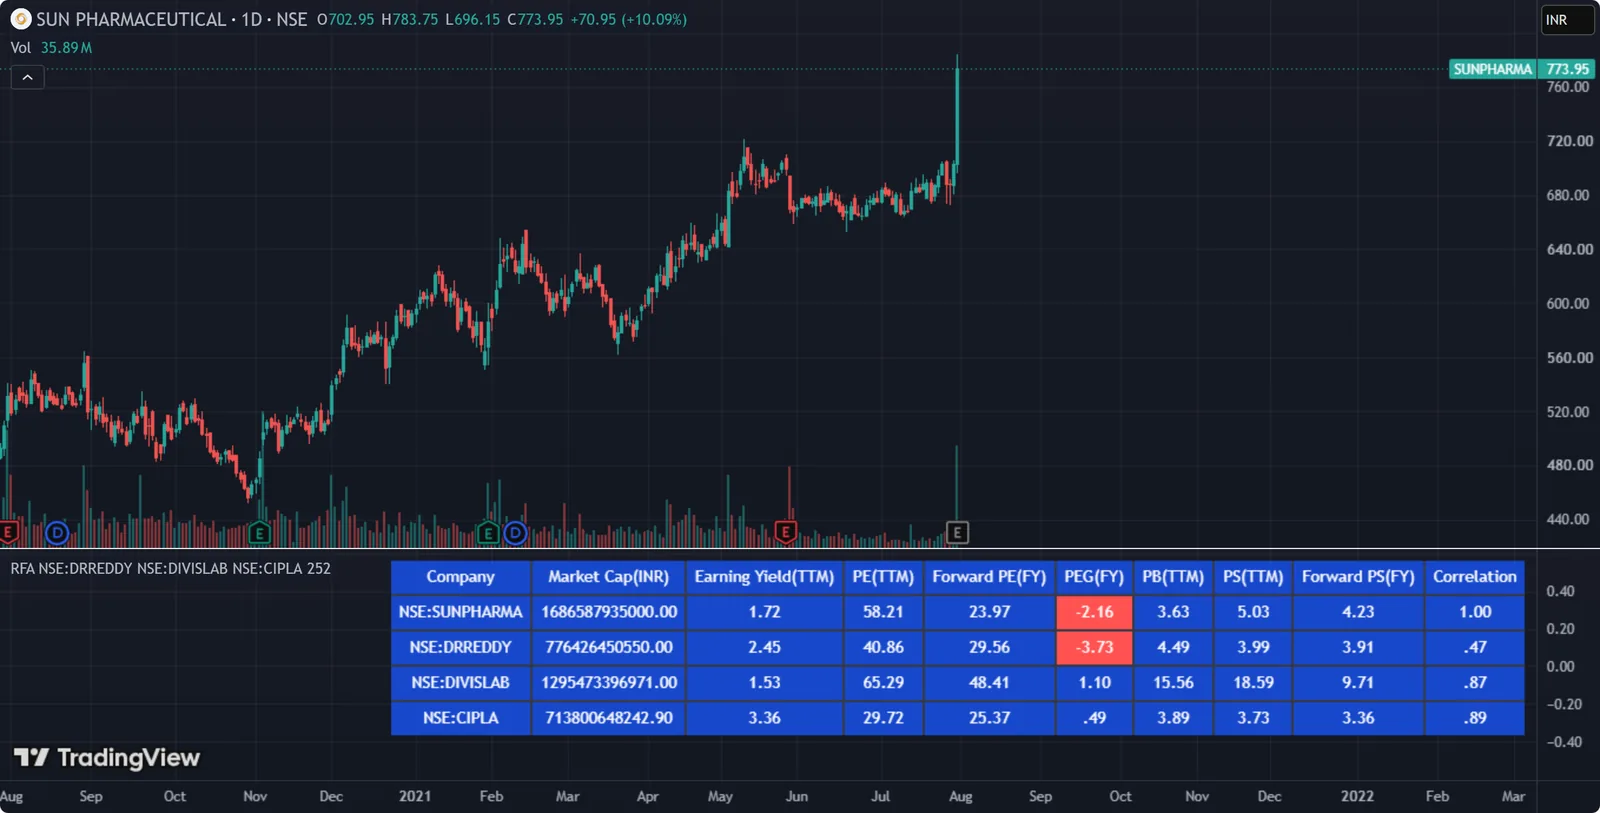
Before I trade a stock, I like to check its basic fundamentals, especially when I don’t know the company well. The quickest way to put the numbers in context is to compare them with the industry leaders.
This script does that comparison on the chart.
What it shows
A table comparing the stock on your chart with three other stocks you choose, across key fundamental ratios, including:
- market capitalisation,
- earnings yield,
- P/E and forward P/E,
- PEG,
- P/B and P/S.
A correlation column shows how closely each stock’s price has moved with the stock on your chart. The default is the last 252 bars.
Good to know
The limit of three comparison stocks comes from a TradingView restriction on how much data a script can request.