Pivots are my favourite indicator. I watch daily, weekly, monthly, quarterly and yearly pivot levels, because where several of them cluster, price often reacts.
The problem: put all of them on a chart at once and you can’t see the price action any more.
What it does
MTF Pivots Zones plots the traditional pivots, with highs and lows, for five timeframes: daily, weekly, monthly, quarterly and yearly.
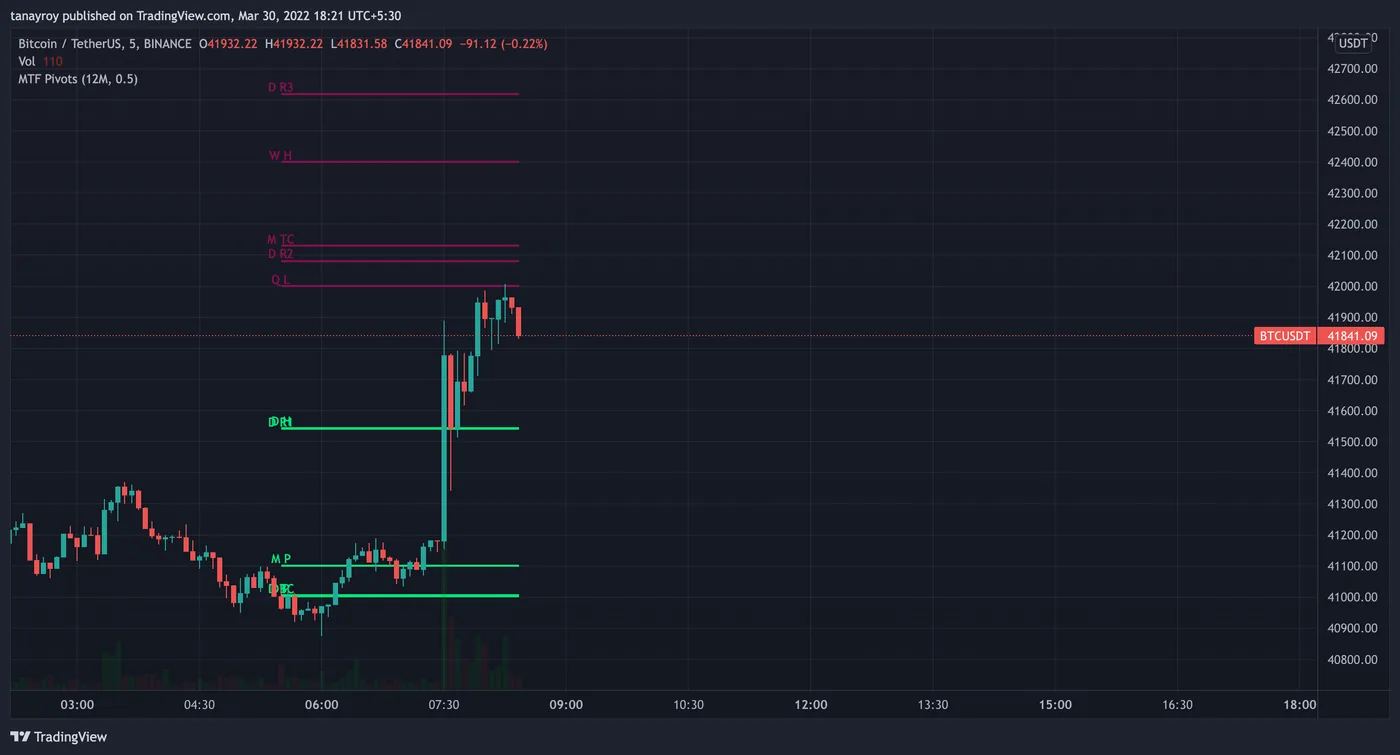
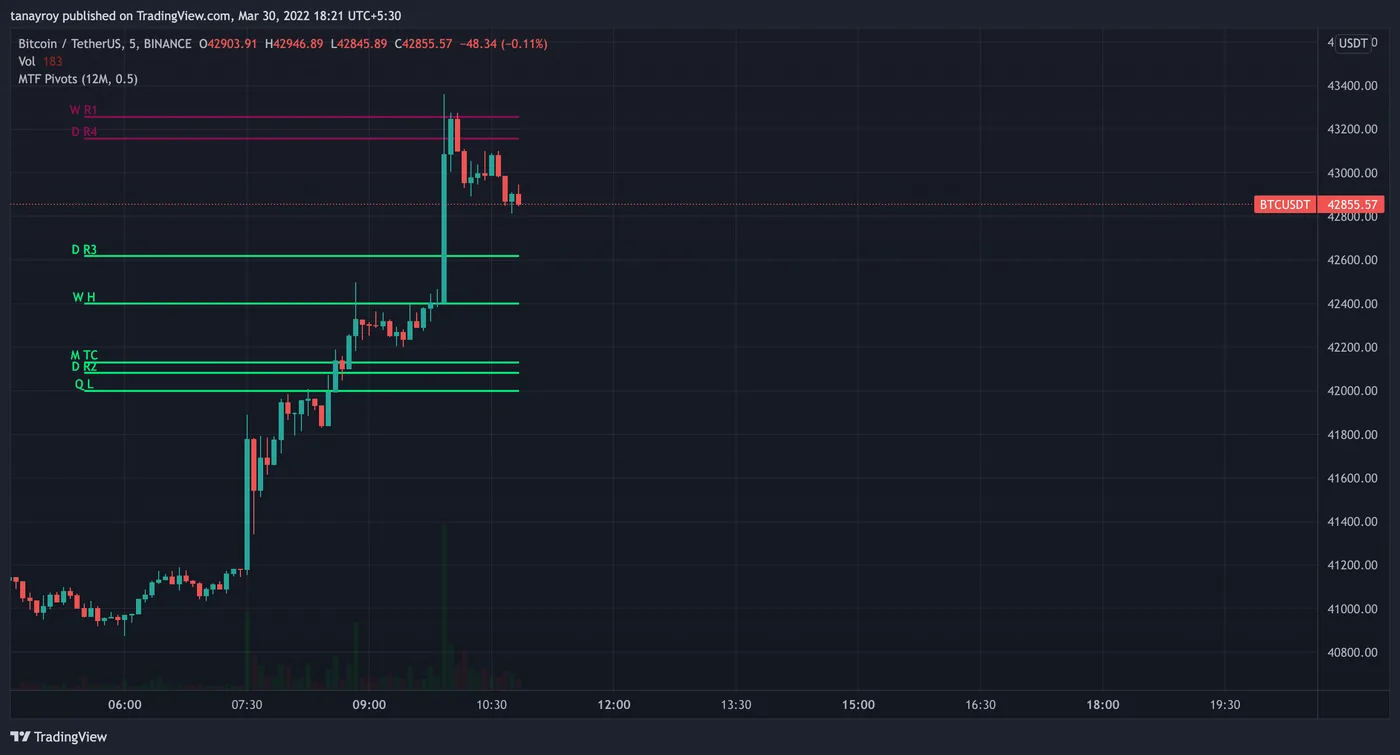
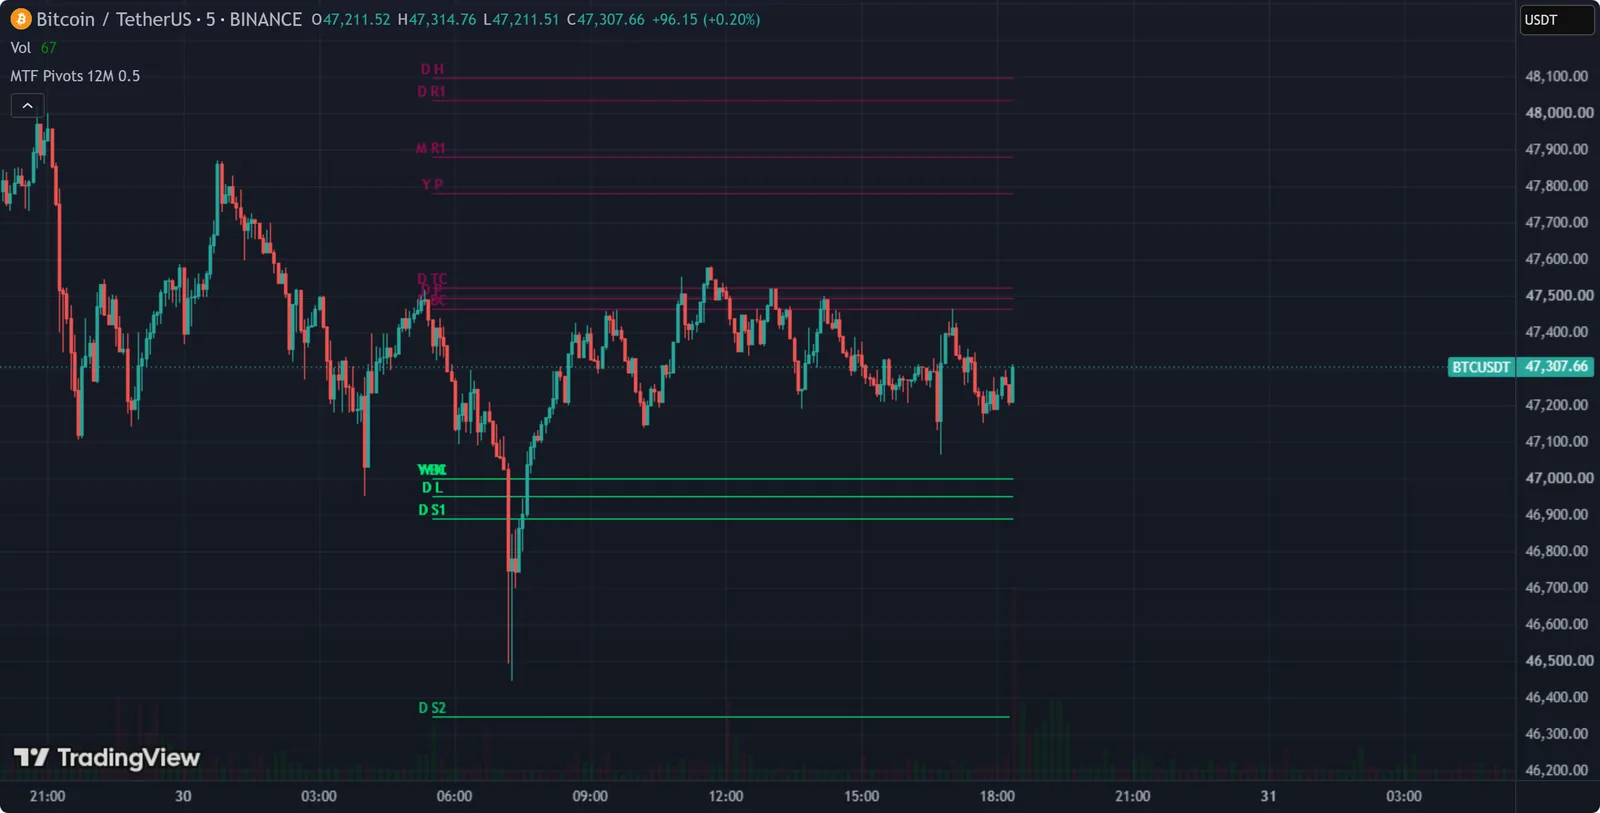
But it only shows the levels that are within reach of the current price. The display range is the 14-period ATR times a multiplier. As price moves, levels that come into range appear, and levels that fall out of range disappear.
Settings
- ATR multiplier: widen or narrow the range of levels shown. The example chart uses 0.5.
- Replace the yearly timeframe with any timeframe you prefer.
How to use it
Use it on 5-minute, 15-minute or 1-hour charts, or any timeframe below daily. Watch for zones where levels from different timeframes sit close together.